

Introduction
Ce logiciel a initialement été développé au MIT dans le cadre d’une recherche menée sous l’égide du Department Of Energy Américain (entre 1975 et 1980). Le programme ASPEN (pour Advanced System for Process Engineering) qui en est résulté est du domaine public. Le projet a ensuite été repris par la société ASPENTechnology (qui regroupe nombre d’anciens chercheurs et enseignants du MIT), qui développe et commercialise le logiciel ASPEN-Plus depuis 1981.
Les principales caractéristiques d’ASPEN Plus sont :
– grand ensemble d’opérations unitaires
– nombreux modèles de calcul des propriétés physiques
– systèmes de régression de données et de génération de tables de propriétés physiques
– méthodes de contributions de groupes permettant de suppléer au manque de données expérimentales pour l’estimation des propriétés physiques
– caractérisation des fractions pétrolières
– système intégré de traitement des électrolytes
– capacité à traiter les solides
– possibilité d’inclure des modèles de l’utilisateur (de propriétés physiques et d’opérations unitaires)
– séquencement et convergence automatique des schémas de procédé (ASPEN est bâti sur l’architecture séquentielle-modulaire)
– possibilité de définir des spécifications de design
– possibilité d’optimisation paramétrique
– choix entre plusieurs algorithmes de convergence pour les recyclages, les spécifications de design et l’optimisation
– évaluation des coûts et de la rentabilité (ce qui inclut des calculs de dimensionnement des appareils)
– interface graphique assez simple d’emploi
ASPEN-Plus peut être utilisé pour modéliser des procédés de :
– chimie organique et minérale, de la grande synthèse à la chimie fine
– pétrochimie
– liquéfaction du charbon
– gazéification du charbon
– traitement des roches bitumineuses
– pulpes et papiers
– agro-alimentaire
– traitement des minéraux
– biotechnologie
What is Aspen Plus?
Aspen Plus (AP for short) is the leading Chemical Process Simulator in the market (or at least in the Chemical Engineering World)
AP is a software that will allow the user to build a process model and then simulate it using complex calculations (models, equations, math calculations, regressions, etc)
There are many perks in AP, from designing new processes to improving existing ones. That is so, that even AP ensures so in its website:
(it will) Maximize profits using a plant-wide simulation solution that combines unparalleled accuracy and engineering collaboration with time-saving workflows.
Lets get more technical:
Given a process design and an appropriate selection of thermodynamic models, AP uses mathematical models to predict the performance of the process.
Engineers will typically simulate this using the software in order to optimize the design and improve existing ones.
This accurate modeling of thermodynamic properties is particularly important in the separation of non-ideal mixtures.
One of the best advantages is that Aspen Plus has already an existing data base of of species and their pure/binary regressed parameters.
It can also handle very complex processes, such as:
- Multiple-column separation systems
- Chemical reactors
- Distillation of chemically reactive compounds
- Electrolyte solutions such as in Chlor-Alkali Industry
- Complex Recycle – Bypass Stream in Processes
Important notes to keep in mind:
Aspen will NOT make the job for you…
It takes an existing design that the user adds/inputs via new flowsheet or existing templates in order to simulate and improve its performance. A good process engineer will be required, as real life applications must be used while using the software. The chemical engineering principles are still required!
1 Les principales caractéristiques d’Aspen
1.1 Opérations unitaires et courants
Aspen est construit autour d’une architecture séquentielle-modulaire. Une opération unitaire est représentée par un sous-programme auquel on fournit les variables des débits d’entrée et les paramètres de fonctionnement, et qui renvoie les variables des débits de sortie.
Un débit est représenté par un vecteur contenant :
– les débits partiels de chaque constituant
– la pression, la température
– l’enthalpie massique, la fraction de vapeur, celle de liquide l’entropie massique, et la densité
Il est possible de décomposer un débit en sous-débits, ayant chacun cette structure générale. Les sous-débits peuvent être du type MIXED (mélange de liquide, vapeur et solide), CISOLID (solide conventionnel inerte vis à vis des équilibres entre phases) ou NC (solide non- conventionnel, c’est à dire auquel on ne peut pas attribuer de formule chimique précise (C’est par exemple le cas du charbon, qui sera représenté par différentes analyses : teneur en humidité, carbone fixe,composés volatils, soufre, en cendres)
1.2 Le calcul des recyclages
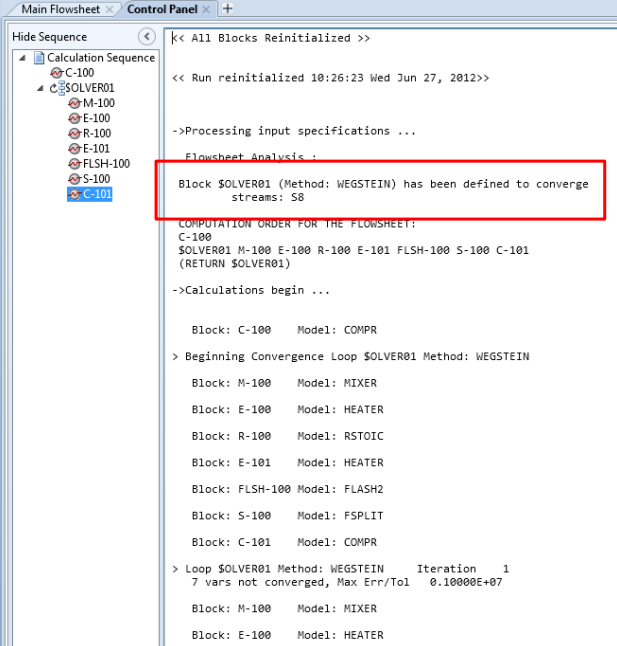
Dans une approche séquentielle-modulaire, les recyclages sont convergés itérativement : on définit un courant “coupé”, et on établit un processus de convergence sur les variables de ce courant coupé, en calculant de façon itérative les opérations de la boucle de recyclage.
A partir d’une description de la structure du procédé (schéma de connexion des opérations unitaires) le logiciel détermine automatiquement les boucles de recyclage, choisit les courants à couper pour permettre la convergence, et détermine la séquence de calcul des opérations unitaires.
Il est néanmoins possible pour l’utilisateur de choisir d’autres courants coupés que ceux proposés par le logiciel, ce qui est très utile lorsque l’on sait en initialiser les valeurs.
1.3 Le système de propriétés physiques
Les propriétés physiques (thermodynamiques et propriétés de transport) sont nécessaires au cours d’une simulation pour le calcul des opérations unitaires (équilibres liquide-vapeur et enthalpies), et pour le dimensionnement (viscosité, conductivité thermique, …)
Un système de calcul de ces propriétés physiques donne ces propriétés comme fonctions des variables d’état (température, pression, composition), à partir de modèles d’origine empirique ou moléculaire, en utilisant des paramètres stockés dans des banques de données (coordonnées critiques, paramètres de corrélation (Antoine), …). ASPEN fournit un grand nombre de « méthodes » de calculs pour ces propriétés physiques, collections de routines de calcul des propriétés physiques qui sont directement utilisées par les modèles d’opérations unitaires.
Le choix raisonné des modèles et corrélations adaptées au calcul des propriétés thermodynamiques et de transport pour un type de mélange donné est souvent un domaine de spécialiste.
Some GUI & Screenshots
Before we continue, let’s se some VISUAL stuff regarding the simulation software so you get an idea of what we are talking about.
Note that GUI = Graphical User Interface…
In my opinion this is one of the “best” things Aspen Plus has to offer: A very easy to use, intuitive and creative interface in which the user can interact with the machine in order to make the simulation in the most comprehensive manner.


An “older” version of the flowsheet

A little of AspenTech History
Aspen Plus is actually a product from the american company Aspen Technologies (AspenTech). You can even see their stock at NASDAQ .

From wikipedia: AspenTech wasFounded in 1981. It was born out a joint research project between the Massachusetts Institute of Technology (MIT) and US Department of Energy—an Advanced System for Process Engineering (ASPEN) Project
Fun Fact: On July 15, 2004, AspenTech was required by the Federal Trade Commission to make divestitures in regard to an anti-trust ruling against its acquisition of HyproTech (they worked on HYSYS). This included divestment of batch and continuous simulation systems and integrated engineering software business (AXSYS).
Since then, AspenTech has been creating a lot of products, mostly in the following branches:
- Process Simulation for Energy
- Process Simulation for Chemicals
- Advanced Process Control,
- Manufacturing Execution Systems,
- Petroleum Supply Chain
- Supply Chain Management
- and much more…
Of these, the most relevant :
Both of them are Process Simulation Software.
What can be modeled and simulated?
There are a lot of processes which can be modeled!
- Heat Exchanges
- Reactors
- Pressure Changers (Valves, Pumps, Compressors, etc.)
- Distillation Columns
- Absorption Columns
- Extractors
- Flash systems
- Separators & Mixers
- Solid Operations (Crushing, sieving, filtration, etc…)
- User models (unique for you!)
Actually, there are unit operations by their own (see Model Palette Below)

Or Physical / Chemical Properties as well: (See two diagrams below)


Or full processes with recycle and bypasses, using also User Model Unit Blocks:

Nice Tools:
- Maximize/Minimize Function: Will minimize or maximize the required variable against other using restraints(e.g. increase profit vs. cooling temperature of a chiller while considering a min. requirement of composition of a product)
- Sensitivity Analysis: will verify the “sensitivity” of a given variable against another. It can be defined by the user and graphed to verify “what if scenarios”
- Convergence & Numerical Method: Verify the number of iterations, range, errors that you are willing to work with
- Copy/Paste/Cut/Delete: this makes it easier to work with the flowsheet and it is very intuitive.
- Hierarchy levels for given process
- Run, Re-Run, Reset, Pause, Stop Simulation as you see fit
- Input data directly or indirectly by re-writing the input windows of blocks and streams
And much more! But is kinda hard to show it here, written! the more you use it the more you will get amazed (and frustrated…)
Who uses this tool?
By now you should know the importance of the software and why it is so powerful… But which companies use this software? Is your industry of interest here? Or maybe you know that at X company they use Aspen Plus…
Well, the most common industries are:
- Oil & Gas (upstream and downstream)
- Petroleum Refining
- Natural Gas
- Petrochemicals
- Chemical Industry
- Polymers
- Pharmaceuticals
- Painting & Coatings
- Food & Bevereages
The other main question you are asking yourself is maybe: who is in charge of the simulation? what is the name of the job? And… You will most likely see the following “job positions” using Aspen Plus in their daily activities:
- Process Engineer
- Simulation Engineer
- Process Design Engineer
- Senior Engineer
- Plant Designer
- Plant Manager
Where can you learn it?

There are many ways you can learn Process Simulation tools suchas Aspen Plus, HYSYS, Unisim, Coco simulator, DWSIM and so on… The most common way to learn Aspen Plus and/or HYSYS and their tools is via AspenTech’s Training center here.
Also, most of us learn it in university, either in our mass and energy balances, maybe in thermodynamics class, or at the end, when working with on a final project regarding plant design.
But I also know there are some guys out there that might/need to learn this by their own so that’s why prepared this blog post just for you! It goes deeper on how to learn process simulation in other alternate ways to the conventional one (via AspenTech). This is important specially if you don’t want to spend/invest that much of a money OR if you need another approach as the traditional one!
Where can I get access to it?
This is also a very common question I get because:
- Aspen Plus is the main Process Simulation tool in the market
- It is very EXPENSIVE (and many of you won’t pay for it)
Unfortunately, the cost of a single license varies from 30K to more than 100K depending on the industry and market, so its hard to get access to the software itself if you do not own it or your company.
The most common ways in which users get access to the software are mentioned here.( At Work, At a Lab / Research Center, In a University,
NOTE: Most courses will not include you Aspen Plus or HYSYS Access! Specially if it is not done via AspenTech. Ensure that you are NOT using an illegal copy or pirated one!
What is Process Simulation?


Lets get something clear about Process Simulation, specially in the chemical Process Industry, is NOT drawing and modeling Equipment alone… It is mostly focused on the physical and chemical characteristic on how unit operations will work!
Process Simulation is the Art of Modeling Chemical and Physical Processes in Computer. I’m sure you have heard about the so-called “computer aided design” or CADS.
As you can imagine, long time ago there were no CADs and most calculations were done on computer or even by hand! So it is now a delight to have a CAD available for Process Simulation… If you don’t think so, I dare you to calculate the viscosity, temperature, pressure and concentration profile on ternary mix of non-ideal substances going through a Distillation Column! Case A – for 10 stages; Case B, for 20 Stages! (good luck!)
If you want to learn more on the art of process simulation, its applications, industries and so on, please check out this blog post.
Why do I prefer Aspen Plus?
This is a blog post based on my PERSONAL OPINION. It shows why I prefer Aspen Plus software over other software such as UniSim, Pro-II and even HYSYS.
All the « Extras » & Plugins
Aspen Plus has plenty of plug-ins, user models and extra software which can be attached to the simulation.

Its community online
I don’t mean the Community you will find on Aspen Tech site. I mean all the engineers you will find online in several places: forums, facebook groups, quora, reddit and so on. They are very helpful and cool, most of them have lots of experience working with AP, even from V3.0
Aspen Plus GUI
I love the clean layout of AP since V8.0, I must admit I really didn’t like V6 and V7 as they were very “boring” but now all is cleaner, more intuitive and can be found easily. In my opinion, they keep upgrading for good (please keep doing so!)

Is THE « standard »
Whenever I talk about process simulation, most of people think about Aspen Plus, which is easier for me, as that is actually the software I use. I would hate it when people would guess “HYSYS” or “Do you mean UniSim?” and so on…
Aspen Plus has become a Industry Standard in the Chemical Engineering Niche and even now in the petrochemical industry.
It is commonly said that if you learn Aspen Plus, you will be able to learn other software, as AP is the standard in which we base process simulation.
Resources everywhere!
I love it when you have resources everywhere, when you just type “process simulation” and you will get books based on AP, or you check out some videos online and most of the material in YouTube is using AP.
Also, most of tutorials and exercises you will find online are either AP or HYSYS
Getting help is easier than ever nowadays!
The Best way to learn Aspen Plus & HYSYS
Process Simulation / / Leave a Comment

I was checking out some stuff in QUORA until I got a Question and Answer request. It was about Aspen Plus… here is the question.
So… what is the best way to learn Process Simulation, Plant Modeling, and all the related Aspen Tech Software skills?
There is no straight forward answer to that, there are many ways in which we humans learn and it will be VERY hard to state the best way to do so.
What we can do is simply state several tips and best practices for learning.
General Tips
Aspen Plus & HYSYS can be learnt in many ways, as any software, the more you get to use it, the more you will be able to learn from it.
Therefore, if you can only take ONE tip –> work a lot with the software! it WORKS!
Check out my e-book if you haven’t. It is about Process Simulation and some of my tips
1) Directly from Aspen Tech
You can find a lot of workshops, tutorials, support center and formal training here.
- Advantage: This is one of the best ways to learn since they are literally the ones who created the software and know the best practices.
- Disadvantages: it is expensive and you need to have the contact already
2) In your University or Lab
this is also pretty common, most students from bachelor level in chemical and process engineering will be taught some basics of the software on how to model several processes and basic unit operations. Here is one example of a university offering it.
- Advantages: you get to work in teams, you get to relate a school project with a real life project. It is relatively cheap as you already paid for it in your tuition.
- Disadvantage: not really a formal training, depends strongly on your instructor and you might miss very important details on the software tools. Your instructor may not guide you into the best practices of the software, as it will

3) From a MENTOR
I learnt directly from my boss and colleagues that have been using the software for decades. They know a lot in how to model specific details and which things are worthy of modeling and what is not. I saved a LOT of time & effort because of this, so try it!
- Advantages: Direct and hands on to project. Industry/product oriented, no need to be modeling things you are not going to use such as compressors if you are into distillation columns alone.
- Disadvantages: They might not have enough time for you to actually explain you how to model things. If they have been using previous versions, they are likely that they won’t know new features of Aspen Plus Version upgrades. Kinda hard to find mentors
4) Online – Courses
There are plenty of courses online that will help you a lot, specially if you are staring from a newbie position. Here is my best course catalogs.
- Advantages: At your pace, relatively cheap. You can get access to online tutor and instructors in some courses. These courses are a great way to pump up your knowledge for basic to intermediate levels.
- Disadvantages: You are mostly on your own. Might be expensive. Typically, will not cover very specific type of simulations. Hard to find extensive offering specially in advanced topics (polymers, biotech, electrolytes, etc.)
5) Online – YouTube
I will say this is one of the most common ways to learn by your own.
There are literally thousands of simulations already in YouTube and you might take advantage of some.
One of the best channels for that is this one right here which has a good structured set of playlists…
- Advantages: At your pace, its for free. Many videos!
- Disadvantages: You are on your own. Some tutors will not explain at all. No good audio/video. Incomplete material. Hard to understand to certain accents. No formal introduction to the problem. Very “basic” material, and not so many “specific” or “detailed” models are found here.
6) Books & E-Books
There are several books and E-books which might be helpful when starting out with Aspen Plus & HYSYS and even at more advanced levels.
This E-book is about “basics” of Aspen Plus, I’m still preparing it but hopefully, it will be available soon!

This E-Book is about learning Aspen Plus in 24 hours and will definitively help you out with setting up your simulations.
This one is about Aspen Plus & HYSYS operations in the real life and how it can be used to simulate existing unit operations & processes.
[UPDATE] I prepared a Blog Post which makes small reviews of the most common types of Books & E-Books out there! Check it out!
7) Using the HELP Button!
Following HELP guides from Aspen Plus. If you take the time to read all the HELP section of every single unit, I can assure you that you will become an intermediate user, just check out these article here.
8) Existing Simulations in Aspen Database
Typically, you will get existing simulations of common processes directly from Aspen Databases.
You can open them, some of them will have explanations, other will not. Some might be tutorials and even be presented as sample/template in the HELP section.
Just work with them and try to make them work.

9) Workshops – Lots of them!
As stated, the best way to learn is by DOING. So try opening that software, play with it, make no worries if you destroy something.
Go out, try to simulate processes from the courses, youtube videos, or tutorials.
The more workshops you do, the better simulations you will get and the more motivated to learn more you will be
The Best BOOKS to learn Aspen Plus & HYSYS
One of the ways I recommend learning Process Simulation, specifically Aspen Plus & HYSYS is by reading books. They might be E-Books or Physical Books, whatever you choose, they will help you through this hard stage of life
I have read several of them and here are my notes. I also added some books that might interest you, but that I haven’t read already.
NOTE: The books are not ordered in any specific order if you were wondering…
Aspen Plus: Chemical Engineering Applications
by Kamal I.M. Al-Malah

This is one the first books I read regarding Aspen Plus. It is simple and straight to the point.
Price: $120 USD approx.
The Good
- Very ordered book
- Straight to the point approach
- Excellent balance between theory and exercise
- Electrolytes & Polymer topics are present
The Bad
- Very low content on Aspen Dynamics. Not so many unsteady state analysis
- No economic or financial analysis
- Does not explores the physical environment extensively
The Ugly
- Expensive!
- This is based on Aspen Plus V8.8 so you might have to adjust several new versions (V9, V10, V11)
Learn Aspen Plus in 24 Hours
by Thomas A. Adams II

I read this one as it stated 254 hours, sounds very millenial “low investment required, extremely high returns granted” but of course it is not the case. It is literally IMPOSSIBLE to learn how to use a Software such as Aspen Plus or HYSYS in a single day.
Price: $35USD approx.
The Good
- Encourages you to read it all by 1-2 days
- Strongly based in Unit Operations
- Includes Capital Cost / Financial Analysis
- Includes Solids & Electrolytes
- Relatively Cheap
The Bad
- No content of Polymers or others (petroleum assays or so)
- No Aspen Dynamic at all. No control analysys
- I will not say this is a “advanced” material course, but definitively an intermediate
- You do NOT learn this in 24 hours
The Ugly
- It is sometime chaotic, images are randomly added and no margins are set
- Aspen Plus V9.0 is used, gotta verify for V10 and V11
Teach Yourself the Basics of Aspen Plus
by Ralph Schefflan

I like the name, it is objective, you can teach yourself the basics Aspen Plus
I like this one, but you must go directly to the exercises, I think it has A LOT of theory or written text which could have been ignored
Price: $70 USD approx.
The Good
- Includes Data Regression Tools
- Mostly based in Unit Operations
- Includes Optimization analysis
- EO (Equation Oriented) study GREAT!
- Very well ordered
The Bad
- No content of Solids, Polymers or others (petroleum assays or so)
- No Aspen Dynamic at all.
- No control analysis
- In my opinion, it has more theory than practice/exercises
The Ugly
- Slow pace, not recommended for inpatient people
- Aspen Plus V8.8 is used, gotta verify for V9, V10 and V11
Using Aspen Plus in Thermodynamics Instruction: A Step-by-Step Guide
by Sandler

One of my favorites if you want to explore the Physical Property Environment.
If you want to learn more on simulation, this is NOT the book for you!
Price: $70 USD approx.
The Good
- Explores the physical property environment
- Great Pace
- Good Exercise-Theory balance
- Lots of exercises & homework
- Excellent for thermodynamic analysis as well!
The Bad
- Does not goes to the simulation environment that much
- Not so many explained/detailed exercises
- Only focuses in physical environment
- Not so many blocks or unit operations are analyzed
The Ugly
- Aspen Plus V8.0 is used, gotta verify for V9, V10 and V11
Distillation Design and Control Using Aspen Simulation
by William L. Luyben

If you are willing to dive into Distillation Columns of all types, this is THE book you need!
In my opinion, this is one of the best written texts for Aspen Plus Simulation (of Distillation Columns) and I would really love if the author would write more on general use of Aspen Plus
Price: $110 USD approx.
The Good
- Explores the physical property environment from a thermodynamic (VLE) & distillation point of view
- Steady State simulation
- Rate Based Simulations Analysis
- Economic analysis
- Dynamic analysis
- Basic Columns, Multiple Componenet, Reactive Distillation, Petroleum Refining, and more!
- Excellent Exercise-Theory balance
- Safety analysis
The Bad
- Contains a lot of Distillation Theory, so you might have to skip that if you already know about it, which I hope is the case
- Only covers Distillation, no other type of process
The Ugly
- Older version than Aspen Plus V8.0 is used, gotta verify for V9, V10 and V11
Learning Aspen Plus from ZERO
by Chemical Engineering Guy

I will be creating an E-book on learning Aspen Plus and/or HYSYS eventually.
If you are interested, please subscribe to the waiting list here
The Good
- It will be Workshop based
- Very BASIC – INTERMEDIATE – ADVANCED structure
- Relatively Cheap $10-20 USD
The Bad
- Still in creation
The Ugly
- No ugly, just beautiful
Some other books…
Some books you might like, and that I have pending to buy/read…


Getting HELP in Aspen Plus & HYSYS
We all been there… You are frustrated because something went wrong in your simulation or you can’t find something regarding the software. Something is missing or some input is extra, anyway it won’t work!
How do you get HELP!?
In this post I’m going to cover the places in which I get information from.
AspenTech « Help » Button
This is, I think, the most straight forward approach whenever you have a doubt. Actually, I would recommend you to read this first, then ask. The more informed you are (about how you are not informed) the better questions and answer you will get.
Read the most relevant things, if you are wondering about a unit operation, read all the unit operations in the bundle.
I would say I base 20-25% of my knowledge due to reading this!


AspenTech Support
- If you have a valid license, then you have the RIGHT of getting SUPPORT directly from Aspen Tech Support Center.
Here, you can find:
- Existing Database of common Q&A
- Open a New Case
- Get Training & Customer Service

AspenTech Community
As in many products and services, you will find a large community of people (clients) interested in it.
Note that you must have a VALID LICENSE in order to have access to such tools.
Facebook Groups
This is another good example of getting an “outside the box” answer to your problems.
There’s nothing better to simply ask to a fellow colleague about a process. He might know the answer and save you a LOT of time!
My favorite places:
- FB Aspen Plus & HYSYS Simulation – (I manage this page)
- FB Aspen Plus Support Group
- FB HYSYS Group
- FB Group: Chemical Process & HYSYS


LinkedIn Groups
Similar to Facebook Groups, you will be able to find some LinkedIn Groups which are by far more “profesional” as you can look at the expertise of such members.
Common groups I’ve found useful:
- Official LinkedIn Group – Aspen Plus
- Official LinkedIn Group – HYSYS
- Unofficial Aspen Plus & HYSYS Triaining Group – (I manage this page)
- Aspen HYSYS – Midstream Users Group
As stated, the main advantage is that there is a network of professionals and that you can ensure that the one answering you is a real/serious human and engineer.
Reddit Forums
I am a Reddit Fan! You can search me if you want here. I do Love going to several sub-reddits but the one of interest now is /ChemicalEngineering unfortunatel, there is still no /ProcessSimulation subreddit so we gotta wait til that opens! For now, let us check the Chemical Engineering Subreddits
Some examples of good posts:
I’m confident you can find more regarding your specific doubt OR simply: POST YOUR DOUBT!
Online Forums
Before there were social media, we used to have “FORUMS” which were sites open to the public in order to treat several topics of interest.
There are some of them which cover Chemical Engineering and others which go deeper and cover Process Simulation.
Instructors / Mentors
Another obvious one is to ask your instructor directly. If you are currently enrolled in a course or training session, take advantage of the Q&A section or comments.
I usually have both, Q&A section and comment section for those interested in doubt. Also, if you might have any doubt you can send it to my e-mail.
Having a Mentor will also help a lot! Simply ask!
YouTube
I will say that YouTube accounts for about 40% of all my knowledge.
You can find plenty of simulation and exercises here, and get help in the comment section if you need to. Also, not only the OP might answer you but other fellow mates will do
See an example here.

Fiverr
Aaaaaand yes…. Our profession is getting degraded so far that now you can get help from an process simulation engineer online directly in Fiverr.com. Some crazy examples start by $5 USD for simulation:
So you can get help that way as well!
Wrap-up
I would say that I have learned:
- 20% reading te help guide
- 30% using youtube
- 20% asking
- 20% forums & FB groups
- 10% random serendipity
NEW to Process Simulation ? – Start Here
So… I guess you are entirely new to Process Simulation? Or maybe only a newbie willing to increase its knowledge of Process Simulation? GREAT, you are in the perfect place.
I prepared this little guide for all those students, engineers, instructors which are lost and don’t know where to start regarding Process Simulation.
Most of them are related to other blog post so feel free to check them out!
Step 1 – Understand What is Process Simulation (PS)
Modeling Chemical Processes allows us to understand the process itself, but also allows us to create “what if” scenarios.
This saves us a lot of resources such as: time, money, human labor, material, etc…
It also help us to design new processes, model existing ones and verify future existing scenarios.
If you want to learn more on the importance of Process Simulation and Why you should learn it, Check out this Blog Post:
Step 2 – Get informed of the several Softwares used in PS
Once you know the importance of Process Simulation (PS), probably you are wondering: Which software should I use? Which one is better for X industry or for Y product? Or maybe you just got access to Z software because of work, lab or university.
Make no worries, we will analyze the most common ones here!
There are two main types: paid and free.
The most common paid software and powerful are shown next:
Note that, because they are paid, they will have more features such as a better customer support, updates, patches, etc…
If you are just getting started by your own, or a small company, or maybe you are low in budget for PS, you can check out the most common FREE Process Simulation Software:

Step 3 – Understand the difference between Aspen Plus and HYSYS
Since the most used family of software is AspenTech, I’m going to assume you are now wondering which one is better? Aspen Plus or HYSYS?
Well, I prepared a Post specially for this question. Short answer –> depends on what you plan to model and simulate!

Step 4 – Where to get Access to such Software
Now that you got your interest in a Process Simulator, I’m going to choose an example Aspen Plus or HYSYS.
Where do you get access to AspenTech Software? How do licenses work?
Check it out here.
Note that if you are willing to get a FREE software, then check out these:

Step 5 – Learn How to Use Aspen Plus or HYSYS
Finally! How does one learns Process Simulation? Is it via a book? At work? An extensive course? Aspen Tech training? Well… actually those are valid! Check out this Blog Post if you want to see what are the most common types of ways in which engineers learn Process Simulation.
Step 6 – Continue your Training…
Now that you started a Basic Course, probably you are wondering what would be the next recommend course… Should you take an “intermediate” course or maybe a “physical property environment” course…
Check out these two blog posts: Aspen Plus and HYSYS.
Why is Simulation and Process Modeling Important in Chemical Engineering?
If you are new to simulation or probably don’t know that much about it, then you might be wondering “why is it so important”?
Well, that’s what we are going to cover here! Please note that simulation is nothing new! it has been here since the existence of computers but of course they have been adjusting to the needs of the engineer. I’m confident that one day will arrive in which the same AI of the software will eventually substitute several Process Engineer tasks, if not all of them!
Process Simulation Advantages
- Saves TIME!
- Saves human error!
- Gets better designs
- Let us picture the process: size, types, dimensions, duties, utilities, costs, etc…
- Can be used for “what-if” scenarios

Process Simulation Disadvantages
- Will always depend on final decision of the engineer
- It will never be 100% accurate
- it bases in several models, iterations and numerical data which can stil have error within
- Process Simulation is not a GOAL but rather a tool to achieve another GOAL
- Will still account for RISKS

Typical things we model…

When modeling, the engineer is likely to model the following:
- Thermodynamic Modeling of pure substance or mixture of substances
- Transport Property modeling
- Model of crude oils, physical properties, chemical and their respective cuts
- Equipment sizing, performance and costs
- Process conditions
- Mass flow rates & compositions, purities, and specification compliance
- Energy and Material balances
- Heat and Cooling Duties as well as Compressor/Pumping requirements
- Health Risk and Hazard Analysis
- Economic analysis (costs, price, sensitivity, profit, etc)
- Technical feasibility
- Optimization with constraints
- What if scenarios, sensitivity of the process
Wrap-up
Process Simulation is powerful as it will allow us to save a ton of time, money, resources and even human lives.
It allows us to open a new panorama, as now our imagination is not the limit, rather what we input/output in the process simulator, we can test multiple case studies in order to verify the best case or the optimal condition.

Process Simulation is also a position which is regarded with high respect and keeps growing as time passes by. The final task of the engineer will be to ensure good practice in the simulations, and, THANK GOD, will always be the one taking the FINAL DECISION.
Aspen Plus vs. HYSYS? What’s the Difference?
What should you choose? What do you want to model? Which software is better for electrolytes, which one is better for petroleum? Are you going to simulate steady state plants or dynamic state? Do you want to do plenty of recycling streams or simple, straight forward process? Do your colleagues use Aspen Plus already or HYSYS?
Yeah….. plenty to answer there…
There are literally a thousand of reasons to use Aspen Plus over HYSYS, and another thousand reasons to use HYSYS over Aspen Plus.
So, what is the difference? Or which one is the most convenient?
A little bit of history…
In order to understand why are there two softwares, let us get back in time…
ASPEN PLUS
Aspen comes from the original project: Advanced System for Process Engineering (ASPEN) Project which was granted to MIT by US Department of Energy in 1981 in order to build a software able to model industrial scale chemical processes. It was later launched for private use.
Here: Aspen Plus 2006 Version, pretty similar to what we have. GUI is not that friendly as we are used to in Aspen Plus V10.
HYSYS
HYSYS is actually a combination of Hyprotech Systems; a copmany founded by the University of Calgary back in 1996 approx. It was originally designed to model petrochemical systems, petroleum assays and hypothetical compounds mainly. It also included a very detailed spreadsheet (green) and a tool bar with streams + blocks, pretty similar to what we have now on Aspen HYSYS V10.

It also includes a GUI similar to Aspen Plus with respect to how we fill properties and input data of blocks:

In May 2002, AspenTech acquired Hyprotech, including HYSYS, so that’s why we have two similar softwares for process simulation.
It is important to note that 2004 ruling by the United States Federal Trade Commission, AspenTech was forced to divest in order to avoid monopoly practices. Therefore, its Hyprotech (including HYSYS source code) was sold to Honeywell.
BTW, Honeywell also got the opportunity to hire HYSYS developers; which lead to the production of the UniSim software.
Main Differences…
Ok so there are of course many differences, so lets check the most relevant ones…
This is not only technical, I checked for other fellow engineers opinions on what is the main difference between each other.
The GUI (Graphical User Interphase)
As in any software, the graphical user interphase (the visual stuff, buttons, structure, folders, overall organization, etc…) is one of the most vital parts! If you do not believe me, then try simulating a fractional column using lines codes!
In my opinion, the GUI of both softwares are pretty similar, and actually I have noted that they are looking each time more equal, as there is a theory that they will eventually be a SINGLE Aspen Tech Software.
Both have the physical & simulation environments.
There are small differences in the GUI such as how adding streams directly in the input of unit operations (HYSYS) vs. doing it later in (PLUS)
- HYSYS is supposed to be more user friendly (allegedly) but it is actually dependant on personal taste, I actually prefer Aspen Plus!
- Typically, HYSYS will be in “run” or “Active” mode, meaning that the simulation is ran every time we change something.
- Aspen Plus will not be ran until we click in the “N” or “Run” button.
Type of Simulation (Equation Oriented)
Tear Streams! yeaaah! The most taunting thing to do in Aspen Plus and is a pain in the A$$!
Thankfully, Aspen Plus allows EO (Equation oriented) Methods which favor the convergence of simulations, specially when there are plenty recycle streams.
HYSYS has the advantage of having blocks for recycling, though will not be always be enough to facilitate the convergence of the whole process
Type of Industry
This is the most common thing I have seen as a main topic of discussion of HYSYS & PLUS.
HYSYS: Petrochemical + Petroleum Refining, Oil Assays and all related Industry
PLUS: fine chemistry, general chemistry, electrolytes, polymers, etc…
Then, simply base your software of choice based on the industry
Going to model petroleum assays? use HYSYS
Going to model polymer reactivity? use PLUS
What do your colleagues use?

Yeah… many times we do not even have opportunity to choose. You just show up to work, and they will tell you which software to use.
If they have been using HYSYS for the last 5 years, then HYSYS will be!
I used to work at a petrochemical company, we modeled isopentane, cyclopentane separation from Naphtha. And we used mostly PLUS!
Pricing… $$$!
Even though they are similar in price, they might change depending on your specific needs and, more importantly, depending on what you are going to be using the most and what type of support you need the most.
As a rule of thumb, generic/bulk processes will require a more expensive license whereas niche applications will not.
Downstream & Upstream Industry
Again, if you are going to be working in the oil & gas industry, mostly oil and natural gas, then use HYSYS. This is shown to be the best software for this. Not only because it was intended to, but also because there is plenty of material online for reference!
Logical Operator Blocks
Sometimes you will have a process which involves a specific set of Logical Operations. Both of HYSYS & PLUS will have this, but depending on your specific need you might end up selecting HYSYS (recycling streams) or PLUS (FORTRAN coding)
PM Block –>

Further Plugins (Addons)
If you are going to be using more plugins (or extra applications form Aspen Tech) then you should base your decision on which you want specifically. Some of them are more reliable using Aspen Plus or HYSYS. For example, the petroleum refinery license will be better integrated directly in HYSYS whereas the polymer extension or electrolyte models will be better suited in Aspen Plus.

Wrap up!
Those were some main difference of Aspen Plus & HYSYS. You should definetively check out what is the BEST fit for your products, process and industry.
Even though it is hard to get used to several softwares, HYSYS & PLUS are actually pretty similar so don’t get frustrated if you have to change from time to time!
ASPEN Tutorial
1. Aspen Introduction
ASPEN is a process simulation software package widely used in industry today. Given a process design and an appropriate selection of thermodynamic models, ASPEN uses mathematical models to predict the performance of the process. This information can then be used in an iterative fashion to optimize the design. This accurate modeling of thermodynamic properties is particularly important in the separation of non-ideal mixtures, and ASPEN has a large data bases of regressed parameters. ASPEN can handle very complex processes, including multiple-column separation systems, chemical reactors, distillation of chemically reactive compounds, and even electrolyte solutions like mineral acids and sodium hydroxide solutions.
ASPEN does not design the process. It takes a design that the user supplies and simulates the performance of the process specified in that design. Therefore, a solid understanding of the underlying chemical engineering principles is required to supply reasonable values of input parameters and to evaluate the suitability of the results obtained. For instance, a user should have some idea of the column behavior before attempting to use ASPEN. This information could come from an approximate method, such as the McCabe-Thiele approach, general modeling of the T-x-y behavior, or residue curve maps.
ASPEN cannot tell you how many stages to use for a given separation. You must set the number of stages and see what type of separation results. Some preliminary or ‘back of the envelope’ calculations are generally recommended.
MSU has a variety of Aspen packages for different simulations. Briefly, here are the programs and capabilities:
Aspen Adsim – Fixed bed adsorption for pressure swing adsorption, etc.
Aspen Chromatography – Fixed bed adsorption, simulated moving bed chromatography. Runs independent of Aspen Plus.
Aspen Custom Modeler – A utility to permit the creation of user unit operations.
Aspen Distil – Aspen’s ‘Conceptual Engineering Product’ for planning for processing schemes. Runs independent of Aspen Plus.
Aspen Dynamics – Unsteady-state simulator.
Aspen Plus – Steady-state process simulator.
Aspen Properties – Modeling of properties and phase equilibria. Incorporated into most other components, though it can be run as a stand-alone subset. All of the phase equilibria and mixture property methods discussed on this site are accessible in either Aspen Plus or Aspen Properties.
Aspen Polymers – Modeling of polymerization reactors and polymer thermodynamics. This package is available within Aspen Plus or Aspen Properties rather than via an external menu.
BatchSep – Batch distillations. Runs independently of Aspen Plus.
Normally undergraduate student projects will involve Aspen Plus or Aspen Properties . To start either of these packages, be sure to look for the corresponding User Interface on the start menu.
1.1 Getting more help
This document is intended to be an overview. ASPEN has extensive online help. Do not try to contact ASPEN directly. They do not respond to student requests. Work through your instructor and TA for getting answers to your questions. If your questions are not answered with online help, see the pdf documents available from the ASPEN documentation folder available on the START menu. Most common tasks are covered.
To find descriptions/equations for the thermodynamic models and parameter variables, are in online Properties Help, Chapter 3.
2. Getting Started with Aspen Plus or Aspen Properties
| Normally undergraduate student projects will involve Aspen Plus or Aspen Properties . To start either of these packages, be sure to look for the corresponding User Interface on the start menu. When you are prompted to connect to the engine (license) configure the window as shown, and click OK. |  |
| Figure 2.1 – Connection dialog |
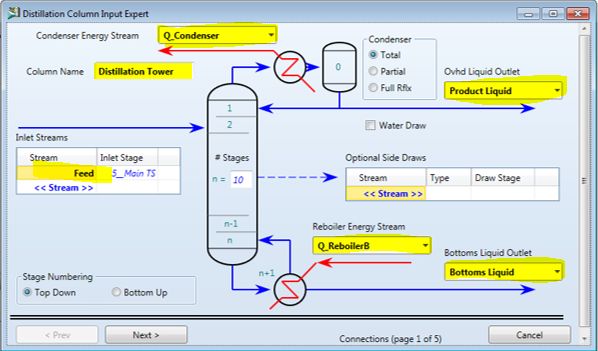
3. Specification of Flowsheet in Aspen Plus
If you are working with Aspen Properties, you may skip to section 4 of this document.
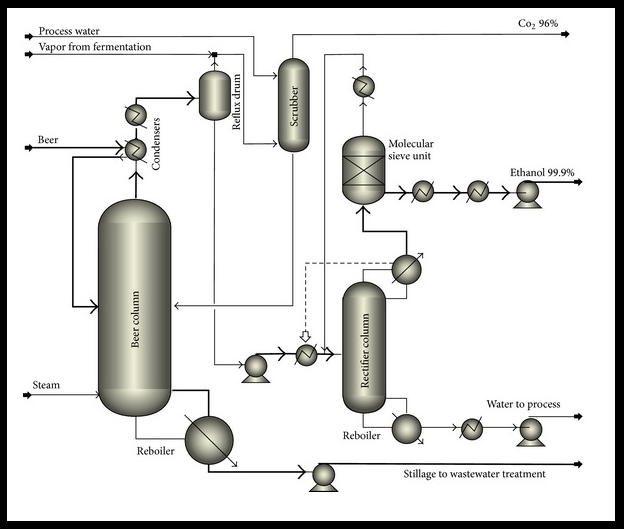
To demonstrate how to build a process simulation using ASPEN, we will develop a distillation column for separation of ethanol and water.
The first step in developing a simulation is to develop the process flow diagram (PFD), which consists of the unit operations (blocks) and streams that feed and connect the blocks. The blocks are listed by category at the bottom of the main window (columns, reactors, etc.) in a toolbar known as the ‘Model Library’, a portion is shown in Figure 3.1. There are a wide variety of block available. Documentation for the algorithm for each block is provided in the ASPEN documentation.

For the ethanol + water system, the short-cut will not be appropriate since the system has an azeotrope. Choose ‘RadFrac’. Click on the small arrow on the right side of ‘RadFrac’ to select the column icon that you want to use on the PFD. The menu will disappear; move the crosshairs to the desired location on the main flowsheet window and click the mouse button.
| Next you have to add streams to the block. Click on the small arrow to the right of the STREAMS button at the lower left corner of your screen (as shown in Figure 3.1), and choose the stream icon you want from the menu (material, energy or work). For this example, set up the feed stream: choose the Material stream by clicking on it. The column will now show arrows where the stream can be connected; red arrows indicate required streams as shown in Figure 3.2 |  |
| Figure 3.2 – Required and optional stream connection points | |
| To set up the feed stream to the column, move the crosshair on top of the red feed position and left click once. Now, move the mouse to the left and click again. You should now have a defined feed stream (Stream 1). For the outlet streams click the column outlet first to connect the bottoms (Stream 2) and liquid distillate (Stream 3).If you make a mistake and want to delete a stream or block, click on the arrow (select) button at the upper left of the Model Library toolbar, then click on the stream or block you want to delete and hit the DELETE key. |  |
| Figure 3.3 – Column after connection of material streams |
Now that you have defined the unit operations to be simulated and set up the streams into and out of the process, you must enter the rest of the information required to complete the simulation. Within Aspen Plus, the easiest way to find the next step is to use one of the following equivalent commands: (1) click the Next icon (blue N ->); (2) find ‘Next’ in the Tools menu; or (3) use keyboard shortcut F4. Any option will open the Data Browser.
4. Configuring Units and Settings
In the Data Browser, you are required to enter information at locations where there are red semicircles. When you have finished a section, a blue checkmark will appear. However, providing some ‘Setup’ settings is often desirable.
You can change default units by opening the ‘Setup’ Folder as shown below.

You can browse the unit sets to see the choices. The base ‘unit-set’ names shown above are reserved names and you cannot modify them. However, if you right-click on a unit set, you can ‘rename’ it and then modify it. Once you have viewed the units you can specify the choice by using the drop down boxes.

If you are running Aspen Plus, you may wish to have stream results summarized with mole fractions or some other basis that is not set by default. Use the ‘Report Options’ as shown below.

5. Specifying Components
Here you have to enter all the components you are using in the simulation. The opening screen is shown below.

5.1 Entering compound information
The easiest way to enter component information is to click on the ‘Find’ button and enter the name of the component. Start by typing ‘ethanol’, and then select ETHANOL from the list of components that appears. Click the ‘Add’ button to add it to the components list. Repeat to add water to the components list. The ‘Component ID’ is an arbitrary name of your choice that will be used to label the component in your calculations. The ‘Type’ is a specification of how ASPEN will calculate thermodynamic properties. For fluid processing of organic chemicals, it is usually appropriate to use ‘Conventional’. If you make a mistake adding a component, right click on the row to specify deletion.

6. Specification of Thermodynamic Methods
Aspen furnishes a « Property Method Selection Assistant » to assist in selection of a reasonable thermodynamic model, Tools>Property Method Selection Assistant. Also, Appendix D of the « Introductory Chemical Engineering Thermodynamics by Elliott and Lira furnishes a flowchart to assist with model selection.
You need to be aware of the manner in which Aspen implements parameter values because Aspen offers temperature-dependent functions in place of parameters, and sometimes uses different signs on parameters than the same models in the literature.
To find information on the property models, access the online help file, and on the page « Accessing other Help », use the link for « Aspen Properties Help ». Then browse to « Aspen Properties Reference ». Then, to find the model description and parameters implementation click in the help window, click on « Physical Property Methods and Models ». Look in Chapter 3 for descriptions of the EOS and activity models. If you have trouble finding « Physical Property Methods and Models » via the online help links, load the correct help file C:\Program Files\AspenTech\APrSystem V7.1\GUI\Xeq\aprsystem.chm. You may also find a pdf file by browsing from the Start menu to C:\Program Files\AspenTech\Documentation\Aspen Engineering V7_1\Aspen Properties\AspenPhysPropModelsV7_1-Ref.pdf.
The screen to select the property method is shown below.

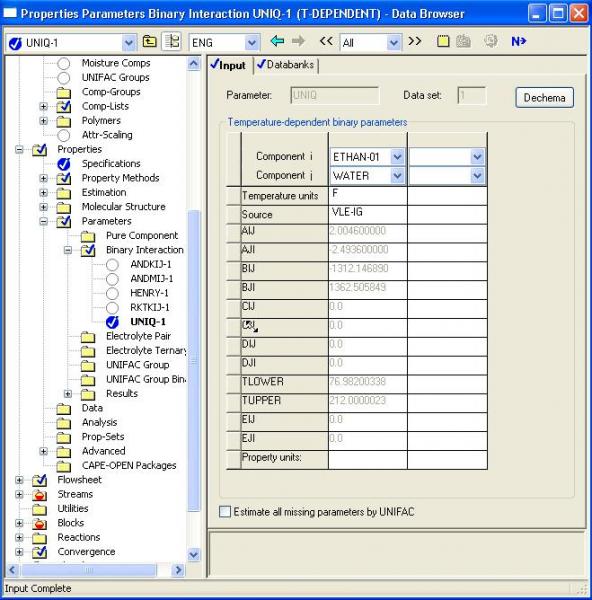
The ‘Process Type’ will narrow down the choices for thermodynamic methods. Often for undergraduate design, ‘Chemical’ will provide a wide range of methods. However to access the van Laar model, you must select ‘all’. The ‘Base method’ will specify the default calculation method for all blocks though you can control which method is used in individual blocks by editing the setup for the individual blocks. You will generally not use ‘Henry Components’ or ‘Free water’. For the example here, select UNIQUAC, a well-accepted model for non-ideal multicomponent liquid mixtures at low pressure.

By clicking the ‘N->’ button, you will be shown the binary parameters as shown in the screenshot below. When you close the window or click ‘Next’, you have provided approval of the values, and you will receive no further prompting for parameter values. If parameters are blank, zeros will be used. This does not imply that the ideal mixture assumption will be used because many models predict non-ideal behavior with parameter values of zero.
Understanding Aspen Binary Parameters
The form of the thermodynamic model parameters usually differs from the form in the published literature because ASPEN often replaces parameters with functions of temperature. To find the form of equation used in Aspen, open the Help file, and from the ‘index’ tab, search for the index for the model name (e.g. UNIQUAC), click on the resulting model name in the index pane, select the entry with the ‘model’ name (e.g. ‘UNIQUAC activity coefficient Model’). You should then see equations very similar to the published literature. To understand where you are within the help file system, switch back to the Contents tab of the help folder and you will see links to the other activity coefficient methods. You will be in Chapter 3 of the Physical Properties Methods and Models Manual.
For UNIQUAC the typical published form of the parameters is
tau.ij = exp(-a.ij/T)
In ASPEN, this is implemented as
tau.ij = exp(a.ij + b.ij/T + c.ij*lnT + d.ij * T + e.ij/T^2)
So the published parameters are related to the aspen parameters:
b.ij (aspen) = -a.ij (published)
WHEN THE ASPEN UNITS ARE SET TO K (See the dialog box above, note the temperature units are specified in the top row of the table).
To verify the pure component values (e.g. UNIQUAC R and Q), in the data browser, click the ‘Components’ folder. Then in the right pane on the ‘selection’ tab, click the ‘Review’ button at the bottom right. The listing will include constants pulled from the Aspen databases, including GMUQR and GMUQQ and GMUQQ1. For our purposes GMUQQ and GMUQQ1 are the same. These should match the values from the textbook.
7. Specifying Stream and Block Information
This section applies to Aspen Plus; if you are working with Aspen Properties, skip to the Section 8.
Click on ‘Next’. Stream specifications will appear. You must choose the stream composition, flow rate, and state for feed streams. The state is specified by pressure, temperature, and vapor fraction. For this example, for the feed stream (1) choose a pressure of 1 atm and a temperature of 25 oC. Now enter the component molar flow rates as 20 kmol/hr for EtOH and 980 kmol/hr for water. (If you enter feed composition as mole fractions, you also have to specify the total flow rate.)

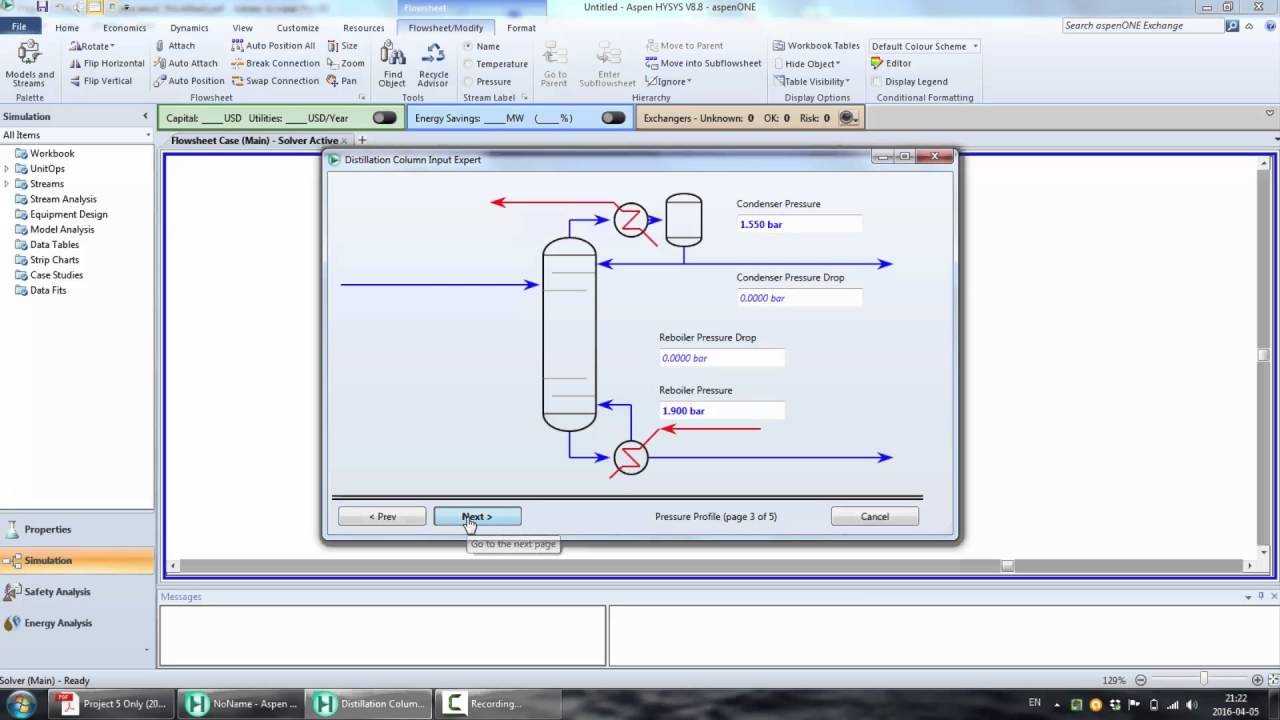
Click on Next. The block (RadFrac) setup will appear. For this rigorous simulation, you must specify the column configuration. Enter the number of stages as 33 and specify total condenser. In the ‘Operating Specifications’ section, set the distillate flow rate to 23 kmol/hr, and set the boilup rate at 1500 kmol/hr as shown below.

Hit ‘Next’ and the ‘Stream’ page appears. Locate the feed stream (1) on stage 17. Hit ‘Next’ to get to the ‘Pressure’ page. Specify the ‘Stage 1/Condenser’ pressure as 1 atm. By leaving the other sections of the pressure page alone, pressure drop through the column will be ignored in this calculation.
7.1 Running the simulation
All required information should now be complete. Click ‘Next’. You should now get a message that all required information has been entered. If you don’t, complete the required form or look at the menu on the left for any red semicircles. To run the simulation, click OK on the message, or you can run the simulation on Run in the ‘Run’ pulldown menu.
7.2 Viewing Results
To view results, click on the blue folder in the toolbar. Choose ‘Stream’ to view stream properties, or ‘Block’ to view column properties. In ‘Streams’, you can look at the streams you wish and place a streams table on your PFD by clicking the ‘Stream Table’ button. (Note: pasted stream tables are NOT updated if you modify the simulation and rerun). To view the RadFrac Block properties, click on Blocks (B1) in the left pane of the data browser.
In a complex simulation, it is sometime more convenient to work with the PFD to find results. Right-click on a block or stream for a short-cut menu to results.
You can bring up compiled reports by going to the ‘View’ menu and clicking on the desired information. The information in the reports is controlled somewhat by the report options introduced in Section 4.
7.3 Reviewing Column Behavior
You can study the behavior of the column by looking at the column profiles as shown below from the ‘Results’ data browser. An example table is shown below.

You can plot the column profiles using « Plot>Plot Wizard… ». For compositions, choose the composition tool, specify liquid mole fractions. The analysis below shows that there may be more stripping stages than necessary for the given column 33 stages, flowrates, reflux and boilup. Naturally, compositions at the top of the column are limited by the azeotrope.

7.4 Printing your work
See the note about the ASPEN print bug workaround at the top of this web page.
You can print the process flowchart and include the stream table if you have pasted it onto the PDF. Go to the ‘Setup’ page, and click on ‘Use Specified Font Size’ in order to get a readable printout. Then select ‘Print’. To print ‘Input Summary’, ‘History’, or results (‘Report’), go to the ‘View’ menu and select your choice. Save the information as a Notepad (.txt text) file, which you can then import into Word or Excel and print much more efficiently. The default reports have more information than you typically need. Avoid printing reports without reviewing them or pasting them in a Word document or you will use up print quota quickly!
7.5 Saving your Work
As you work with Aspen plus and Aspen Properties, saving files in the ‘backup’ format will assure that they can be opened in the next version of Aspen. Currently it is not possible to open ‘standard’ files when upgrading Aspen. The backup format ends with an ‘bkp’ as the last part of the file extension.
7.6 Running the simulation again, and reinitializing
You will want to modify your process parameters to run the case again. After modifying, you can click the ‘Next’ button, or the ‘Run’ button. The ‘Run’ button is blue ‘>’ triangle in the main toolbar.
Aspen will ‘reuse’ the last state to start the next simulation. When a case crashes, this is usually not desirable. To reinitialize, use the ‘|<‘ button in the main toolbar.
Be sure to explore the phase behavior of the systems in your design. It can be frustrating to try to get Aspen to give a physically impossible result, but many students have struggled with this, and blame Aspen. Not all separations are possible because of azeotropes, pinch points, and/or distillation boundaries.
8. Additional Features to Explore Thermodynamic Behavior
8.1 Obtaining a complete set of thermodynamic parameters.
The default folder views do not give you a full view of the parameters used by APSEN. To get a full view, use ‘Tools -> Retrieve Parameter Results…’.
8.2 Stream Reports with Additional Property Information
To see mole fractions of each phase in a mixed stream of multiple phases, you can add mole fractions as property sets for the specific phases. If you build you simulation from a specialty chemical template, the property sets XTRUE (liquid mole fraction) and VMOLFRAC (vapor mole fraction) are available. If these property sets are not available because your simulation did not use the template, you can create custom property sets that include the vapor and liquid mole fractions. (Properties->Prop-Sets->New… and then choose the mole fractions as the ‘Physical Properties’ and the appropriate phases on the ‘Qualifiers’ tab).
To add these property sets to a stream report, Setup -> Report Options -> Stream Report Tab -> Click the ‘Property Sets’ button and select the desired property sets to add to the stream report.
Note that it also possible to add activity coefficients, fugacity coefficients in this manner. To view special properties, create a custom view of the stream report.
8.3 Calculating Pure Properties, Binary Phase Behavior or Ternary Residue Curves
Once all data has been loaded, you may use ‘Tools -> Analysis -> Pure…’ or ‘Tools -> Analysis -> Binary…’ or ‘Tools -> Analysis -> Residue…’ to evaluate properties.
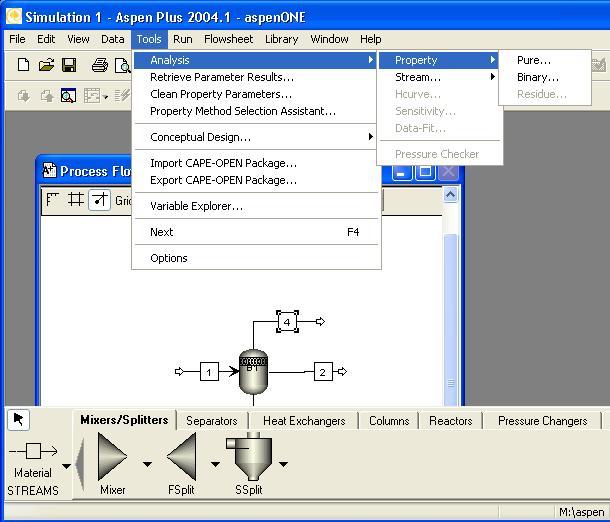
For example, after setting up a acetic acid + water system to use the Hayden-O’Connell method for vapor fugacities and the UNIQUAC method for liquid properties, a T-x-y diagram can be quickly generated using ‘Tools -> Analysis -> Binary…’. Be sure to edit the ‘Valid phases’ box if you expect there may be ‘VLL’ equilibria. (Do not use ‘Free Water’ unless you can safely assume that an aqueous liquid phase is pure water. This assumption can sometimes be used in petroleum processing of hydrocarbons, but is not valid for most functional organics).

The diagram is displayed:

When you close the diagram you will find the table with some intermediate calculations. If you would like to get the values into Excel, drag the mouse over the columns, and copy. Then paste into Excel.
Here is another example for methanol + benzene.


8.4 Calculating Mixture Properties
It is also possible to plot fugacity coefficients, activity coefficients, or other properties as a function of composition or temperature, etc. Mixture properties typically require that you specify a property set and then ‘run’ the case.
First, specify the components as shown in Section 5. To get properties as a function of composition at a fixed T and P, you will have to set up a property set and then request execution of the set.
8.4.1 Establishing the property set
Open the folder for ‘Properties>Prop-Sets’.

Click ‘New…’
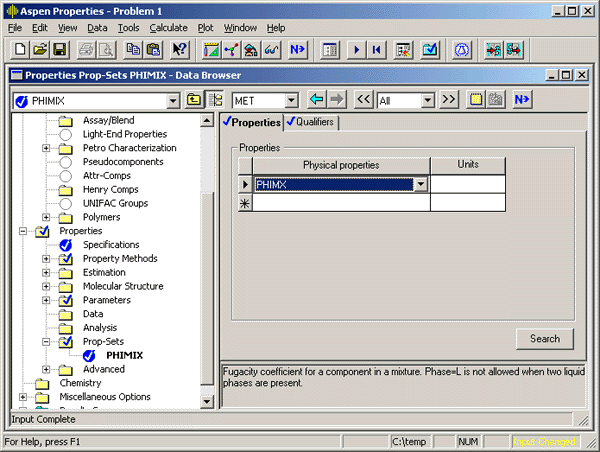
Give the ‘Property Set’ a name that will help you remember the calculated properties. In this example the property set is called ‘PHIMIX’. On the ‘Properties’ tab, select the APSEN name for the property that you want to tabulate. You will probably need to consult the documentation to find the ASPEN name for the property. In this case, I will select ‘PHIMX’, the ASPEN name for the component fugacity coefficient in a mixture. Enter the units if appropriate for your property.
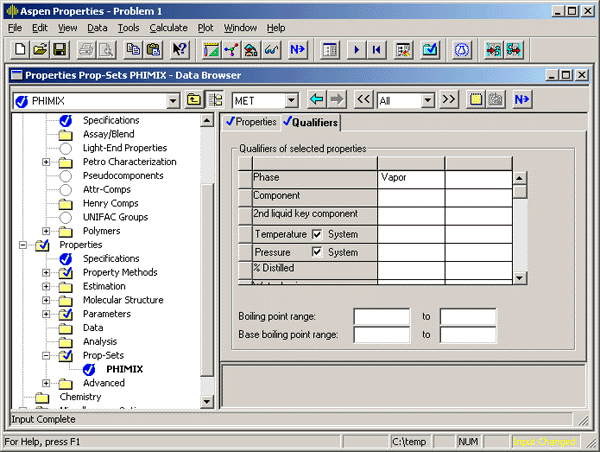
On the ‘Qualifiers’ tab, set the other details for the calculation. In the case of fugacity coefficients, I chose to calculate them for the vapor phase.
To instruct ASPEN how to use the property set, you next specify the analysis to be performed.
8.4.2 Specifying the Analysis to run for the property set.
Select the folder for ‘Properties>Analysis’. The screen will look much like the ‘Property Set’ page in Section 8.4.1 ‘Establishing the Property Set’. Click ‘New’ and name the analysis set. I will call mine ‘PhiCalc’. Also for most properties you will want to select ‘Generic’ unless it is clearly an envelope or residue curve. T-x-y, P-x-y and residue curves are accessible more easily as shown in Section 8.3 ‘Calculating Pure Properties, Binary Phase Behavior or Ternary Residue Curves’.

On the ‘Systems’ tab, if you intend to specify the temperature and pressure, specify ‘Point(s) without a flash’. It will be necessary to set the flow rates even though there isn’t any real process stream. If not necessary for the calculation, ASPEN will ignore them.

On the ‘Tabulate’ tab, specify the Property Sets for the analysis, and move them to the right list box:

For summary of the output, click the button on the page for ‘Table specifications’ and give the table a name and specify the precision desired, as shown below.

On the variable tab of the ‘Property Analysis’ set, you will specify the fixed state variables and the adjusted variables as shown below. Note that the upper section of the form is for the Fixed state variables, in this case set to be 120C and 1 atm. The lower table has been edited to vary the mole fraction of acetic acid. Before leaving the form, the values or range for the adjusted variables must be specified. To provide this information, first put the cursor in the variable field (e.g. the variable ‘Mole fraction’ is selected below), and then click the form button named ‘Range/List’ to specify the range/list for that variable.

Specify the Range or List of Values to be varied as shown below. Here the range will be from 0 to 1 at intervals of 0.05.

8.4.3 Generating the calculated values
At this point, ASPEN has enough information to calculate the desired information. Click the ‘Run’ button on the toolbar. The ‘Run’ button is the blue triangle in the top tool bar (it is ‘grayed out’ on all screen shots on this web page). You can tell that results are available when the ‘Analysis’ folder changes to blue as shown below. Note that the blue ‘PHICALC’ folder has ‘Results’ available. The columns of calculations as shown below can be copied to the Windows clipboard by dragging the mouse over the column titles, using the Edit menu (or Ctrl-C). The clipboard contents can be pasted into Excel.

8.5 Sharing parameter values between simulation files
When a significant number of user parameters have been entered, it is convenient to transfer them to another file in a more efficient method than a copy/paste method. This section discusses a method to export parameters and import them into a new simulation.
As an overview, Aspen Properties files hold all the pure component and binary parameter information, but none of the process schematic information. They also include information about the property ‘methods’ including customization of how the vapor phase fugacity is calculated, etc., and all reaction chemistry, etc. Plus they hold user parameters that have been used to specify property information and binary interaction parameters.
So it is possible to export an Aspen Properties file from one aspen simulation using File>Export, and then import it into the other simulation. When you export, choose the Aspen Properties backup format, *.aprbkp for greatest compatibility. I also strongly suggest that you open the exported file using the Aspen Properties interface and enter a good description of the properties file in the description window (Setup>Description). This description is viewable when using the File>Open dialog box which is helpful. Resave the properties file after documenting the file.
When you import to a new simulation using File>Import, you must select from a list the properties that you wish to import, and there are two options: merge or replace. I have not studied these closely, but it in my trials, I had to use ‘replace’ to overwrite the binary parameters. Also, I did not have the patience to figure out which row in the property list imports the binary interaction parameters. I just used shift-click to select all rows and used the ‘replace’ button.
*If you notice any errors or outdated information on this page, please contact Professor Lira who maintains this content.
Aspen Plus™ Information
Creating and Simulating Chemical Reaction Models with Aspen Plus™ 12.1
WELCOME to the ASPEN PLUS™ Pages! ASPEN PLUS™ is a software package designed to allow a user to build a process model and then simulate the model without tedious calculations.
Our web module that has a full example of use of Aspen Plus™ to model Pyrolysis of Benzene is available thorugh the button below.
ASPEN PLUS™ can be used for a wide variety of chemical engineering tasks. For example, it can execute tasks as simple as describing thermodynamic properties of an ethanol and water mixture, or as complex as predicting the steady-state behavior of a full-scale petrochemical plant. This web site, however, will introduce ASPEN ™ as a handy tool for simulating reaction engineering scenarios, such as designing and sizing reactors, predicting reaction conversions, and understanding reaction equilibrium behavior.
So, get to know ASPEN PLUS™ by following the outline below. It will surely enhance your understanding of chemical reaction phenomena and the engineering behind them!
Introduction to Aspen Plus™ 12.1
Engineers are constantly being called upon to predict the behavior of systems. Chemical engineers in particular must be able to predict the actions of chemical species, a very difficult task. As chemical engineering students, when confronted with a large chemical system, you might ask, « Where do I even begin? Mass balances? Energy balances? Thermodynamic properties? Reaction Kinetics? » Over the past few years as a student you’ve learned about each of these crucial topics separately, however, « real world » situations will require an engineer to incorporate all of these areas.
This is where the idea of a process model is helpful. A process model can be defined as an engineering system’s « blue print. » The process model is a complete layout of the engineering system including the following:
- Flowsheet
The process model flowsheet maps out the entire system. The flowsheet shows one or more inlet streams entering into the system’s first unit operation (i.e., heat exchanger, compressor, reactor, distillation column, etc.) and continues through the process, illustrating all intermediate unit operations and the interconnecting streams. The flowsheet also indicates all product streams. Each stream and unit operation is labeled and identified. - Chemical Components
The process model specifies all chemical components of the system from the necessary reactants and products, to steam and cooling water. - Operating Conditions
All unit operations in the process model are kept under particular operating conditions (i.e., temperature, pressure, size). These are usually at the discretion of the engineer, for it is the operating conditions of the process that effect the outcome of the system.
Sound confusing? Well can you imagine keeping track of all of this by hand, then solving all the mass and energy balances, determining thermodynamic behavior, and using reaction kinetics just to determine what size reactor to use, or how much product you’ll achieve?
ASPEN PLUSTM allows you to create your own process model, starting with the flowsheet, then specifying the chemical components and operating conditions. ASPEN PLUSTM will take all of your specifications and, with a click of the mouse button, simulate the model. The process simulation is the action that executes all necessary calculations needed to solve the outcome of the system, hence predicting its behavior. When the calculations are complete, ASPEN PLUSTM lists the results, stream by stream and unit by unit, so you can observe what happened to the chemical species of your process model.
So continue on and check out how to use ASPEN PLUSTM as a tool in solving some reaction engineering problems.
Accessing ASPEN PLUSTM
At the University of Michigan, Ann Arbor
ASPEN PLUSTM is installed on CAEN computers and the Duderstadt Center computers. ASPEN PLUS runs on Windows™ computers throughout the Dederstadt Center. See the CAEN office, 2nd floor Media Union, for locations of CAEN labs on campus.
At Other Universities
Inquire at your computing sites about the ASPEN PLUSTM software package. It may be installed on an on-line directory, or on an individual computer’s.
Getting Started
At the University of Michiugan, once you are logged on to a computer with ASPEN PLUS™, follow these instructions to open for ASPEN PLUSTM. If you not at the University of Michigan open ASPEN PLUS and go to step 4 .
- Click the Start button in the lower left of the screen and select All Programs
- Put your cursor over Engineering Applications then Aspen Tech and then Aspen Engineering Suite
- Move the cursor over Aspen Plus 12.1 and click on Aspen Plus User Interface. ASPEM PLUS™ will open and a widows installer window will also open. If the installer asks you to specify the location of a file, click on Cancel and then again on Cancel in the Windows installer window.
- Once ASPEN PLUS™ opens, you have to choose between using a template or a blank flowsheet. Check the Template box and select ok.

- Then select the template you want to use from the Simulations tab and hit ok. For this tutorial we will use General with English Units
- ASPEN PLUS™ will then be ready to connect to the simulation engin. At the University of Michigan select Local PC from the Server Type pulldown menu. (Again a Windows Installer window will apear. Select Cancel if you are asked to specify the location of a file.) At other universities please refer to the help desk at your computer site for the appropriate selection and information to connect to the simulation engine.
- Once ASPEN PLUS™ connects to the simulation engine, you are ready to begin entering the process system. Your screen should look similar to the one below.

Creating a Reaction Engineering Process Model
Now that you have gained access to ASPEN PLUSTM, you are ready to begin creating a process model. The following series of steps will create a process model for the tubular reactor (PFR) example problem 4-3 taken from the 4th Edition of Elements of Chemical Reaction Engineering by H. Scott Fogler.
Here is a summarized version of the problem:
Example 4-3
Determine the plug-flow reactor volume necessary to produce 300 million pounds of ethylene a year from cracking a feed stream of pure ethane. The reaction is irreversible and elementary. We want to achieve 80% conversion of ethane, operating the reactorisothermally at 1100K at a pressure of 6 atm.C2H6 (g) ![]() C2H4 (g) + H2 (g)A
C2H4 (g) + H2 (g)A ![]() B + C
B + C
Where A is gaseous ethane, B is gaseous ethylene, and C is gaseous hydrogen.
Other information:
- Fao = 0.425 lbmol/s (calculated from 300 million pounds of ethylene at 80% conversion)
- k = 0.072s-1 at 1000K
- Activation Energy, E = 82 kcal/gmol
Building the Process Flowsheet
The first step in creating a process model is drawing the flowsheet in ASPEN PLUSTM, much like you would on paper. Note that while you’re constructing the flowsheet, text in the lower right corner will state « Flowsheet Not Complete. » This will change to « Required Input Incomplete » when the flowsheet is finished.
Unit Operations
The easiest way to create the flowsheet is to start with the Unit Operation and add the streams to it.
- Along the bottom of the window there are several tabs with different types of equipment as labels. Click on the Reactors tab.
- There are seven different types of reactor models in ASPEN PLUS™ 12.1. For this example we are going to use RPlug
- Click on the RPlug button once and then click again on the blank process flowsheet. You will notice on the left of the different reactor buttons there is a down arrow wich brings up a pulldown menu. You can change the icon that appears on the process flow sheet from this menu. There will be no difference in the calculations ASPEN PLUS™ performs. The icon affects only the appearence of the flowsheet.

- You should now see an icon for a plug flow reactor on the process flow sheet. It will arbitrarily be named B1. (you can change the name later)
Inlet (Feed) Streams
Next we need to add the inlet stream.
- There is a button labled Material STREAMS at the lower left of the window. Click on this button.
- When you move the cursor onto the process flowsheet you will see two red arrows and two blue arrows appear on the reactor. These arrows indicate places to attach streams to the reactor.

- Move the cursor over the red arrow at the top of the reactor. This is the feed stream. Click once when the arrow is highlighted and move your cursor so that the stream is in the position you want. Then click once more. You should see a stream labled 1 entering the top of the reactor icon.
You have finished adding the inlet stream. Note this example only has one arrow (representing the ethane feed). More than one inlet stream can be drawn. Note also that if you have more than one reactant in the feed, you do not need more than one inlet stream in ASPEN PLUS™. You can specify multiple components in one stream.
At this point your screen should look something like this:
To finish our flowsheet we need an outlet stream
Outlet (Product) Streams
You are now ready to add the outlet stream (containing both ethylene and hydrogen) to your flowsheet. Repeat the steps described above for the inlet stream, however instead of highlighting the red arrow at the top of the reactor, highlight the red arrow ar the bottom. Of course, for other examples, there could be more than one outlet stream.
Your screen should now look like this:

Connecting the Streams to the Unit Operation
If you did not connect the stream to the unit when you created the stream, you can still attatch it to the unit.
- To attatch a stream already on the flowsheet, first click on the arrow button, directly abovee the Material STREAMS button.
- Double click on the end of the stream you wish to connect to the unit. Your mouse will now control the end of the stream.
- To attach the stream simply move the end of the stream over one of the red or blue arrows on the unit. While the arrow is highlighted click once more and the stream will be attatched to the unit.
Entering Process Conditions
Now that the process flowsheet is complete, it is time to enter the process conditions. In the bottom right of the screen the warngin message has changed from « Flowsheet Not Complete » to « Required Input Incomplete ». This means that entering conditions, operating conditions or kinetic information is missing. ASPEN PLUSTM will guide you through the required input windows, simply click on the next button  near the middle of the main toolbar. When each input is complete, a
  will appear next to the completed section in the explorer window on the left.
- Click Next with the left mouse button. A window will prompt you that the flowsheet is complete and asks whether the next input form should be displayed. Click OK (At the University of Michigan, a Windows Installer window appears again. As before you should cancel the Installer (it may take several times before the Installer finally quits).
- The first input window will be called Setup Specifications. With the left mouse button, click once on the Title box to highlight it, enter the title of your process model.
- Check that the desired units are correct. You can change the units in the pull-down menu under Units of measurement. Click on the desired units.
- A should appear next to Specifications in the navigation window on the left. Click Next.
The next input window is Components Specifications. Here is where all of the chemical species in your process model are specified.
- For this particular example, the components are: ethane, ethylene, and hydrogen. Start with the second to last column called Component name. Click on the first row in the column and type in: ethane. Hit Enter.***Note: If you are unsure of how to spell the chemical name, or do not know whether it’s in the ASPEN PLUSTM library, simply click the Find button below the components table. From here you can search for the correct chemical.
- Ethane is in the ASPEN PLUSTM chemical library. Notice how the molecular formula automatically appears after typing it in. Now click under Component ID. Enter an id name (to show up in results) for ethane, perhaps ETHA. Hit Enter.
- Repeat steps 5 and 6 for ethylene and hydrogen. In this example, the component id names used were ETHY and H2, respectively.
- appears. Click Next.
The next window to appear is Properties Specifications. Here is where you specify the solving engine used to simulate your process model.
- From the Property method pulldown menu select SYSOP0
Hit Enter. - appears. Click Next.
Once the required properties information has been input and you click the next button, a window will pop up asking weather to continue to the next step or to modify the properties. Check the circle next to Go to Next required input step.
The next window to appear is Streams. Here is where you specify the components, temperature and pressure of input streams.
- Under « State variables » go to the menu that says Temperature. Enter 1100 and from the pulldown menu to the right of the entry select K for Kelvin.
- In the Pressure entry type 6 and select atm from the pulldown menu.
- Now look to the right and find the Composition table. From the first pulldown menu select Mole-flow and change its units to lbmol/sec from the right pulldown menu.
- Since ethane is the only component of the inlet stream, click in the box next to ETHA and enter 0.425 for the molar flowrate.
- appears. Click Next.
The next input window is titled B1. This window is where you will specify the operating conditions of the PFR. This is the window you will come back to upon running the simulation to change any operating conditions as well.
- You start at the Specifications tab. From the Reactor type pulldown menu select Reactor with specified temperature.
- In the Operating conditions section mark the first choice: Constant at inlet temperature
- Click Next
- Click in the Length box and enter a value. 10 feet is a good starting point. Be sure the units are ft. Change the units accordingly via the pull down menu method if necessary.
- Do the same for the Diameter box. 3 feet is a good guess for the diameter. Be sure the units are in ft.***Note. You are solving this problem by guessing a volume. When you run the simulation you will see what conversion is achieved with the guessed volume. You will keep changing the volume (increasing/decreasing the length while keeping the diameter constant) and rerunning the simulation until the desired conversion is achieved. Remember that a PFR is a cylinder with a volume of V = (Pi/4)D2L.
- Hit the next button. (The will not show up yet)
- The next window asks you to select a reaction set. However, you have not created a reaction set yet. From then navigation menu on the left, double click on the Reactions folder. Two subfolders will appear. Click on the Reactions subfolder.
This is where you will specify the stoichiometry of the reaction occurring in the PFR.
- In this window, selct New
- Enter a name for the reaction ID (for this example we used R-1) and then selcet LHHWH from the Select type pulldown menu. Hit ok.
- This takes you to the Stoichiometry tab. From here select New….
- Under Reactants, select ETHA from the Component pulldown menu.
- Now look at the balanced reaction equation in the problem statement. The coefficient of ethane is 1 so enter 1 in the Coefficient box. Notice that ASPEN PLUS™ automatically changes coefficients of reactants to negative numbers.
- Under Products, select ETHY from the Component pulldown menu. Enter a 1 in the coefficient box. Then select H2 from the Component pulldown menu and enter 1 for the coefficient. Click on the Next button to close the window and again to advance to the next input.
The next input is under the Kinetic tab. Here you will describe the rate law of the reaction in the PFR.
- The reaction you just entered should be shown in the first pulldown menu. From the Reacting Phase pulldown menu select Vapor
- Then enter the information in the Kinetic Factor section.
- Enter 0.072 for k, 82 for E, and 1000 for To. Make sure the units for E are kcal/mol and K for To.
- Lastly, the rate law must be entered. To do this click on the Driving Force button to the right.
- This example has an elementary rate law, hence, -rA= kCA. Therefore, under the Reactants, enter 1 in the box next to ethane (ETHA). Type 1 for the Exponent.
- Under Products, Enter 0 for the Exponents of both ethylene and hydrogen (ETHY and H2).
- Enter 0 for all four driving force constants (A, B, C, D) at the bottom of the window.
- from the Enter term pulldown menu, select Term 2. Since this was an elementary reaction and there is no second term enter 0 for all exponents and B, C, and D coefficients.
- Due to the method ASPEN PLUS™ uses to specify reactions, you must enter a very large negative number for coefficient A. -10000000 should work. This will make term 2 essentially 0, leaving us with the elementary rate law. Click Next to close the window.
- Click Next
- This takes you back to the B1 block. If you remember, we did not specify a reaction set for the PFR becasue we did not have one created. Now that we are done creating our reaction set, we need to add it to blcok 1. Select R-1 (or whatever you titled the reaction) and select the button.
You are finished entering all the required data for the process model! You will see Required Input Complete in the bottom right corner of the window. Click the Next button again and a window will appear asking if you wish to run the simulation. Click OK.
Running the Process Model
Congratulations on completing the flowsheet and entering the process model conditions. Now you are ready to put your model to the test. Example 4-3, the cracking reaction, can now be simulated.
Once you’ve clicked OK to run the process model, the Control Panel window will appear. This window gives you a look at the ASPEN PLUSTM « thinking process. » Phrases indicating the PFR block is being executed will scroll across the screen. When the simulation is complete, the Control Panel will read: Simulation calculations completed.
Interpreting the Results
- Once the simulation is complete, click the Next button on the Control Panel.
- A window will pop up with three choices. Mark the first choice, Display Run-Status results form, and click ok.
- A window titled Results Summary will appear. Click on Streams in the navigation window on the left.
For the Example 4-3 simulation the stream results screen should look like this:

Note that, down the left side of the screen, are the different parameters: temperature, pressure, mole flow, etc. Along the top row are the stream id names, in this case 1 and 2 (inlet and product). This forms a grid of information that can be interpreted easily.
In Example 4-3, the problem asks for the PFR volume that will achieve an 80% conversion. As you recall, when entering the process model conditions, you guessed a volume by entering an arbitrary length and diameter of the PFR. In order to complete the problem, you must see what conversion your process model obtained. Recall that conversion is defined as:X = (moles of limiting reagent reacted)
(moles of limiting reagent fed)
Where moles reacted = moles in – moles out
To solve for conversion, do the following with the results:
- Under Mole Flow for ethane, calculate the moles of ethane that reacted: stream 1 – stream 2
- Divide this number by the molar flowrate of ethane into the PFR: stream 1.
If you followed the example exactly, using a length of 10 feet and a diameter of 3 feet, you should get a conversion of 76%.X = stream 1 – stream 2
stream 1
X = 1530 lbmol/hr – 361.641 lbmol/hr
1530 lbmol/hr
X = 0.76 = 76%
The dimensions of the PFR did not achieve an 80% conversion. Therefore, you need to go back and adjust them. It is easiest to vary the length of the PFR while holding the diameter constant. In this example, since the conversion was too low, you must INCREASE the length of the PFR.
Changing Process Conditions and Rerunning the Model
Adjusting the input conditions is very straightforward, just follow these steps:
- With the mouse pointer, click on the close button for the Results window and then the Control Paenl window (do not close ASPEN PLUS™)

- You should now see the input specifications window (where you entered information on reaction kinetics, reactor size, etc…)
- Browse to the Blocks > B1 > Setup page from the left explorer window and click on the Configuration tab.
- Click in the box of the value you wish to change. In this case change the Length to a value greater than 10 feet (Hint: Try 11.42 feet!).
- Use the explorer window on the left to browse through the input data if you need to change more parameters. If not, keep clicking Next until you are prompted with « Run Simulation Now? »
- Rerun the simulation, and check your results.
In Example 4-3, you will find that a length of 11.42 feet and a diameter of 3 feet will achieve an 80% conversion. To finish the problem, the volume of a PFR with these dimensions is V = 80.72 ft3.
ASPEN PLUS™ Example Problems
This section is devoted to example reaction problems. The problems were taken from the 4th Edition of Elements of Chemical Engineering by H. Scott Fogler. Both problems come from Example 8-5, the first is an adiabatic reactor and the second is a PFR with constant cooling temperature. Please note, it is assumed that the user knows how to create a flowsheet and enter process conditions, since these examples explain only the values to enter for each input window.
Example 8-5 Adiabatic Production of Acetic Anhydride
Jeffreys, in a treatment of the design of an acetic anhydride manufacturing facility, states that one of the key steps is the vapor-phase cracking of acetone to ketene and methane:CH3COCH3![]() CH2CO + CH4
CH2CO + CH4
He states further that this reaction is first-order with respect to acetone and that the specific reaction rate can be expressed byln k = 34.34 – 34,222/T (E8-5.1)
where k is in reciprocal seconds and T is in Kelvin. In this design, it is desired to feed 8000 kg of acetone per hour to a tubular reactor. If the reactor is adiabatic, the feed pure acetone, the inlet temperature 1035K, and the pressure 1 62 kPa (1.6 atm), a tubular reactor of what volume is required for 20% conversion?
Creating the Flowsheet
The flowsheet consists of one inlet stream, a PFR, and one product stream. It should look like this:
Create a flowsheet like this in ASPEN PLUSTM. If you do not know how, see Example 4-3. When the flowsheet is complete, Required Input Incomplete should appear in the lower right corner of the screen. Click the Next button. Click OK when prompted to Enter Required Data.
Entering Process Conditions
This section will explain what values to type in for each input window. If you do not know how to enter values, change units, or navigate through the input windows, see Example 4-3.
Setup
- Title: Enter any title you wish.
Components
- Under Component Name type the following in a column: ACETONE, KETENE, METHANE
- Under Comp ID type in any id names for the above components: A, K, C1
- Click Next
Properties
- From the Property method pull-down menu select SYSOP0
- Click Next.
- Click OK when prompted about continuing entering stream input.
Stream
- Description: Enter any description of stream 1.
- Temp: 1035 K (change units if necessary)
- Pres: 1.6 atm (change units if necessary)
- Composition: Change to MASS-FLOW KG/HR
- For a mass flowrate of A (acetone) type 8000. Leave ketene and methane at zero (no mass flow in reactant stream).
- Total: Change to MASS-FLOW and enter 8000 KG/HR
- Click Next.
Blocks
- Description: Enter any description for PFR, perhaps Adiabatic PFR.
- Type: ADIABATIC
- Length: Need to guess a length, 3 METERS is a good starting point.
- Diam: Need to guess a diameter, 1 METER is a good starting point.
- Click Next
- After you create the reaction set, add it in the Reactions tab
Reactions – Stoichiometry
- Select New…
- Reaction Name: enter a name for the reaction set
- Select Type: LHHW
- Select OK
- In Stoichiometry select: New
- Under Rectants: select acetone from the components pull-down menu and set the coefficient to -1
- Under Products: select ketene and methane and set both coefficients to 1
- Click Next.
Reactions – Kinetic
- Select the reaction from the pulldown menu
- Change Reacting Phase to Vapor
- Enter 1.125 for k
- Enter 1000 K for To
- Enter the activation energy E of the Arrhenius equation, 67999 CAL/MOL. This value was solved for using equation E8-5.1:k (s-1) = 8.2x10¹⁴exp(-32,444/T)
(Note that R is missing in the denominator.)Activation Energy = E = (32,444)(R)E = (32,444)(1.987 cal/mol K) = 67999 cal/mol
Reactions – Kinetic – Driving Force
- Under Reactants: set acetone exponent to 1
- Under Products: set ketene and methane exponent to 0
- Set constants to 0
- Select Term 2 from the pull-down menu
- Set all Exponents and constants B, C, and D to 0
- Set constant A to -1000000
- Click Next.
Running the Simulation and Interpreting the Results
Click Next again until you are prompted to run the simulation. Click OK. When the simulation is complete, click next and choose to Display Run-Status results form. If you do not know how to interpret the results window, see Example 4-3. Otherwise, check the conversion (X = moles reacted/moles fed). Does X = 20%? If X < 20%, you must increase the length of the PFR. If X > 20%, you must decrease the length of the PFR.
In this case where length = 3 m, diam = 1m, the conversion was greater than 20%. Therefore, you need to go back to the PFR and input a smaller length. You must access the Rplug.Main window to do this. If you do not know how to reenter inputs, see Example 4-3.
This time, try a length of 2.5 m while holding the diameter constant at 1 m. When you rerun the simulation, you will find that X = 20%! Finishing up the example, the volume of the PFR with these dimensions is V = 1.96 m3.
Example 8-5 Operation of a PFR with Heat Exchanger
We again consider the vapor-phase cracking of acetone used in Example 8-5:CH3COCH3![]() CH2CO + CH4
CH2CO + CH4
The reactor is to be jacketed so that a high-temperature gas stream can supply the energy necessary for this endothermic reaction (see Figure E8-5.1). Pure acetone enters the reactor at a temperature of 1035K and the temperature of the external gas in the heat exchanger is constant at 1150K. The reactor consists of a bank of one thousand 1-in. schedule 40 tubes. The overall heat-transfer coefficient is 110 J/m2-s-K. Determine the temperature profile of the gas down the length of the reactor.
Figure E8-5.1
Creating the Flowsheet
Use the same flowsheet as the adiabatic example.
Entering Process Conditions
Follow instrctions for Setup, Components, Properties, Stream, Reactions – Stoichiometry, reactions – Kinetic, and reactions – Kinetic – Driving Force. The only chnage from the adiabatic example is in the Block input data.
Blocks
- On the Specifications tab, change reactor type to: Reactor with constant coolant temperature.
- Enter the heat transfer parameter U: 110 J/sec-sqm-K.
- Enter the coolant temperature: 1150 K
- Length: Need to guess a length, 3 METERS is a good starting point.
- Diam: Need to guess a diameter, 1 METER is a good starting point.
- Click Next.
- If the reaction set has already been made add it in the Reactions tab
Run the simulation. Again, adjust the length until the conversion is X = 20%. In this example, the proper length was 1.9 m with a diameter of 1 m. Thus the volume was V = 1.49 m3.
Temperature Profiles down the Length of the PFR
To see the temperature profile down the length of the PFR, do the following:
- In the left explorer window, double click on blocks and then select B1
- From the main file menu, select Plot and then Plot Wizard
- In the window that appears, hit next, and then select Temperature. Hit Next
- Find the « Which X-axis variable would you like to plut? » Mark the reactor Length choice. Change any other options (such as units) and when you are done select Finish. You will see the plot of temperature as a function of reactor length.
You should see a plot of the temperature profile that looks like this:

Other Useful Information
Saving Your Process Model
It is wise to save your process model periodically while working. To save the model:
- Select the File pull-down menu from the tool bar. Click on Save As.
- Enter a name for your process model and find a directory to save it to. Click Save.
- There will be 6 files created everytime you Save As. If you are saving to a floppy disc or to your AFS space it is possible to only keep two or three of those files to successfully re-open your process model. If you are not sure which ones are necessary, simply keep all of them.
- The name of your process model will now appear on the window. From this point on, select Save under the File menu to save your process while you work.
Printing Your Process Model
The flowsheet and results are valuable documents verifying your work. ASPEN PLUS™ allows you to individually print a flowsheet, stream-by-stream result pages, and a history file.
The Flowsheet. To print your process model’s flowsheet do the following while the flowsheet window is active:
- Select the File pull down menu from the tool bar. Click on Print or Print Preview.
- select the correct printer from the pull-down menu and hit OK.
Stream-by-Stream Results. To print the stream-by-stream results, follow steps 4 above while the results window is active.
The History File. Printing the history file of your process model will allow you to step through all of the computer code used in solving the simulation. The history file keeps track of all previous ASPEN PLUS™ runs executed while you’ve been logged on. Depending on the complexity of the process model, the history file can be very lengthy (100 pages or more!). Therefore, evaluate whether a hard copy of this file is necessary before you print.
ASPEN PLUS™ creates the history file after completing one run of the process simulation. To print the history file do the following:
- Browse to the directory with your saved ASPEN PLUS™ files. Find the file with a « .his » extension. It will have this as its icon.

- Double click on the file and it will open in Notepad or a similar program.
- From Notepad select Print from the File pull-down menu.
Changing Names of Streams and Unit Operations
ASPEN PLUSTM arbitrarily assigns ID names to all streams and unit operations on the flowsheet you create. If you wish to change the ID name, do the following:
- With the RIGHT mouse button, click on the ID box of the stream to pull down a menu.
- About half of the way down the menu, select Rename Block or Rename Stream whichever the case may be.
- When the Rename box appears, type in the desired ID name and click OK.
Exiting ASPEN PLUS™
When finished with your process model, do the following to exit the ASPEN PLUS™ program:
- Pull down the File menu.
- Click on Exit.
- A window will appear asking if you wish to save your process model run. Click No if you do not wish to save the run, or Yes if you do.
- The ASPEN PLUS™ window will disappear and you will return to the Windows™ desktop.
4th Edition
The ASPEN PLUSTM 12.1 web site for the 4th edition was created by Brian Vicente at the University of Michigan, Summer 2004.
3rd Edition
The ASPEN PLUSTM web site for the 3rd edition was created by Ellyne E. Buckingham at the University of Michigan, Summer 1997.
Special thanks to:
Anuj Hasija and Professor H. Scott Fogler
The University of Michigan at Ann Arbor, MI
Dr. J. Mahalec
ASPENTech at Cambridge, MA
All ASPEN screen shots courtesy of ASPENTech.
Final editing of the ASPEN PLUSTM web site for the 3rd edition done by Dieter Andrew Schweiss, Fall 1997.
Aspen PlusTM WorkshopforReaction Engineering Design
Created 3/12/2002 by Nihat M. Gurmen Updted 2/11/2010 by Maria Quigley University of Michigan
Department of Chemical Engineering
Ann Arbor, MI
ASPEN PLUS™ Example Problems
This section is a tutorial to walk you through Problem 11-3 for the 1st edition of Essentials of Chemical Reaction Engineering. You can download the ASPEN backup file here that completes this problem.
Example 11-3 Adiabatic Liquid-Phase Isomerization of Normal Butane
Problem Description
Normal butane, C4H10, is to be isomerized to isobutane in a plug-flow reactor. This elementary reversible reaction is to be carried out adiabatically in the liquid phase under high pressure using a liquid catalyst which gives a specific reaction rate of 31.1 h-1 at 360 K. The feed enters at 330 K.
- Calculate the PFR volume necessary to process 100,000 gal/day (160 kmol/h) at 70% conversion of a mixture 90 mol % n-butane and 10 mol % of i-pentane, which is considered an inert.
- Plot and analyze X, Xe, T and -rA down the length of the reactor
- Calculate the CSTR volume for the same conditions as the PFR.
Components
Three components are considered in the Aspen model: C4H10 (n-butane), IC4H10 (isobutane) and IPENTANE (2-methyl-butane). The liquid catalyst is not included because its flowrate is not known and the specific reaction rate has been given for the reaction condition. These three components are called directly from built-in Aspen pure component databanks.

Properties
Different property models can yield different predictions for various thermophysical properties used in mass and energy balance calculations. PENG-ROB, Aspen Peng-Robinson equation-of-state property model, is chosen to describe the thermophysical properties of this hydrocarbon liquid mixture. One of several equations-of-state well-known to be suitable for hydrocarbon systems, Peng-Robinson equation-of-state should provide reasonable calculations for heats of reaction and heat capacities.

Within the temperature range of 330 K to 360 K, PENG-ROB predicts liquid heat capacity of 157-185 J/mol•K for C4H10, 161-214 J/mol•K for IC4H10, and 176-195 J/mol•K for IPENTANE. The higher the temperature, the higher the heat capacity will be. Pressure also affects liquid heat capacity. The predictions here are done at 1 atm.
The isomerization heat of reaction is also a function of temperature. PENG-ROB predicts the heat of isomerization to vary from -7430 J/mol C4H10 at 330 K to -7080 J/mol C4H10 at 360 K.
Reactions
To describe the n-butane isomerization reaction, an Aspen reaction model of POWERLAW type is created: ISOMER. The ISOMER reaction is rate-controlled. The reaction stoichiometry is shown below:

Both forward and reverse reactions are 1st order with respect to reactants.

The forward reaction specific rate is 31.1 h-1 (0.008639 sec-1) at 360 K with activation energy of 65.7 kJ/mol (65.7×10⁶ J/kmol). The reactant concentration is given in terms of molarity (kmol/m3).


It is also known that the heat of reaction is -6900 J/mol of n-butane and the chemical equilibrium constant is 3.03 at 60°C.

The above equation gives Keq=2.51 at 360 K. Therefore, the above equation can be rewritten as follows.

From k’ and Keq, we can derive at the rate constant for the reverse reaction, k ».


Flowsheet
Aspen model library provides RPLUG (PFR) reactor model and RCSTR (CSTR) reactor model. They are used to construct processes with proper feed streams and reactor conditions.

Problem (a)
Aspen RPLUG reactor model is used with reactor type Adiabatic Reactor and reaction model ISOMER. Aspen requires input of reactor dimensions in lieu of reactor volume. To start the simulation, initial values of 0.1 meter in diameter and 1000 meter in length are assumed.

It is found that the conversion of C4H10 reaches a maximum of about 72%. 70% of C4H10 conversion is achieved with reactor length of 410 meter, or 603 second of residence time. That gives reactor volume of 3.22 m3.

Problem (b)
Profiles for the molar compositions of C4H10 and IC4H10 and the PFR reactor temperature are given below.

Problem (c)
Aspen RCSTR reactor model is used with heat duty set to 0 (i.e., adiabatic) and reaction model ISOMER. To start the simulation, initial value of 3 m3 is assumed for the CSTR reactor volume. C4H10 content drops from 90 mol % to 33.7 mol % (62.5% conversion) with this initial volume of 3 m3.

A DESIGN-SPEC block is set up to find the reactor volume required for 70% C4H10 conversion. The study shows a reactor liquid volume of 20.6 m3 is required to achieve 70% C4H10 conversion. That corresponds to a residence time of to 3678 seconds, more than 6 times that of the RPLUG residence time.

Given the models, various reactor analyses can be performed. For example, a PFR reactor liquid volume of 1.41 m3 is required to achieved 40% C4H10 conversion while a CSTR reactor requires only liquid volume of 1.30 m3.
